
Table of Contents
- What Data-Driven Vacation Rental Management Actually Means
- Why Revenue Per Available Room (RevPAR) Matters More Than Occupancy Alone
- Vacation Rental Key Performance Indicators You Must Track
- Vacation Rental Dynamic Pricing Tools and Strategies
- Short-Term Rental Market Analysis for Competitive Advantage
- Data Integration and Automated Workflows
- Data Privacy, Security, and Small-Scale Implementation
- Building Your Data-Driven Vacation Rental Strategy
Last Updated: August 7, 2026
What Data-Driven Vacation Rental Management Actually Means
Data-driven vacation rental management is the systematic practice of collecting, analyzing, and acting on property performance information to optimize revenue, occupancy, and guest satisfaction rather than relying on intuition or historical patterns alone. At Marquis Stays Property Management, we've found that owners who shift from reactive management to data-informed decision-making consistently outperform their peers in both revenue and operational efficiency.
The difference is fundamental. Traditional management relies on seasonal assumptions ("summer is always busy") and manual adjustments. Data-driven management uses actual booking patterns, guest feedback, market conditions, and competitive intelligence to make precise pricing, marketing, and operational decisions in real time.
This distinction matters because the vacation rental market has become significantly more competitive. Property managers who don't track the right metrics often miss revenue opportunities or misprice properties relative to comparable inventory. The data tells you exactly what's working and what isn't, no guesswork required.
Why Revenue Per Available Room (RevPAR) Matters More Than Occupancy Alone
Most property owners fixate on occupancy rate: "My property is booked 75% of the year, so I'm doing well." That metric is incomplete and often misleading.
RevPAR (revenue per available room) is the metric that actually determines financial success. It combines occupancy rate with average daily rate (ADR) into a single number that reveals true revenue performance. A property booked 80% of the time at $100 per night generates less revenue than one booked 60% of the time at $200 per night. RevPAR exposes this immediately.
RevPAR = (Total Revenue / Number of Days in Period) or (Occupancy Rate × Average Daily Rate)
Why this matters in practice: Many owners optimize for occupancy by dropping prices aggressively. They hit 85% occupancy and think they've won. Meanwhile, they've left significant revenue on the table because they're underpriced relative to market demand. RevPAR forces you to think about both variables simultaneously. A small increase in nightly rate combined with slight occupancy loss often produces higher total revenue.
The strategic insight is this: if your RevPAR is stagnant, the problem isn't necessarily low occupancy, it's likely that your pricing strategy doesn't match your market position. This is where competitive benchmarking becomes essential. You need to know what similar properties in your area charge and how that correlates with their occupancy rates.

Vacation Rental Key Performance Indicators You Must Track
Beyond RevPAR, several other metrics drive operational and revenue decisions. Tracking the right KPIs prevents you from chasing vanity metrics that don't actually improve your bottom line.
Occupancy Rate, Average Daily Rate, and Booking Velocity
Occupancy rate is the percentage of available nights your property is booked. It's the foundation metric, but it's meaningless without context. A 70% occupancy at $150/night is entirely different from 70% at $75/night.
Average daily rate (ADR) is your nightly price across all bookings. Track this separately from occupancy because pricing and demand are linked but distinct variables. If your ADR drops while occupancy stays flat, you've made a poor trade-off.
Booking velocity is how quickly reservations fill relative to the arrival date. Properties with strong booking velocity fill 60-70% of available nights within 30 days of arrival. Weak booking velocity means you're selling last-minute inventory at discounted rates. Tracking this tells you whether your marketing and positioning are working or whether you need to adjust pricing or visibility.
A common mistake is ignoring booking velocity entirely. You might hit your occupancy target, but if 80% of bookings arrive within 7 days of check-in, you're forced to discount heavily because guests have limited options. Conversely, properties that see bookings arrive 45-60 days in advance can command premium rates because demand is clear and predictable.
Guest Sentiment and Conversion Metrics
Guest reviews and ratings directly influence future bookings. Properties with 4.8+ star ratings see higher conversion rates on listing pages than those rated 4.5 or below. This isn't just about reputation, it's about algorithmic visibility on booking platforms.
Conversion rate measures what percentage of property views result in bookings. A 3% conversion rate is typical; 5%+ is strong. If your conversion rate is below 2%, your listing description, photos, or pricing is misaligned with viewer expectations.
Track review sentiment beyond star ratings. Guests mention specific pain points in text reviews: "The WiFi was slow," "Checkout was confusing," "Housekeeping missed the bathroom." These comments reveal operational issues that directly affect future bookings. A property with 4.7 stars but consistent complaints about cleanliness will lose bookings to competitors with 4.6 stars and flawless cleanliness reviews.
Vacation Rental Dynamic Pricing Tools and Strategies
Dynamic pricing is the practice of adjusting nightly rates based on demand, seasonality, and competitive positioning. Properties that use dynamic pricing strategies consistently outperform those with fixed pricing.
The mechanics are straightforward: raise prices when demand is high and inventory is tight; lower prices when demand is soft and you have excess availability. The execution is where most owners struggle. Many adjust prices manually based on intuition. Others set prices once per season and never revisit them.
Data-driven dynamic pricing uses actual market signals. When your competitors raise rates and maintain occupancy, you have room to raise yours. When booking velocity slows, you adjust pricing downward to stimulate demand. When a major local event approaches, you price premium rates weeks in advance.
How Seasonality and Market Intelligence Drive Pricing Decisions
Seasonality is predictable. Coastal properties in Costa Rica see demand peaks during North American winter (December-March) and summer (June-August). These patterns are consistent year to year. What changes is the magnitude and timing of demand.
Market intelligence tells you whether this year's high season will be stronger or weaker than last year's. If tourism statistics show a 12% increase in arrivals to your region, you can confidently raise rates. If major competitors are dropping prices, you need to understand why, is it a market-wide slowdown, or are they struggling specifically?
A practical approach: Set base rates based on your annual RevPAR target and historical performance. Then adjust 10-20% up or down based on:
- Lead time (bookings arriving 60+ days out warrant premium rates; last-minute bookings warrant discounts)
- Occupancy trajectory (if you're tracking below pace, discount to stimulate demand; if you're ahead of pace, raise rates)
- Local events (holiday weekends, conferences, festivals drive demand; adjust accordingly)
- Competitive positioning (monitor 5-10 comparable properties and price relative to them)
The mistake most owners make is treating pricing as a set-and-forget decision. Market conditions change weekly. Your pricing should reflect those changes.
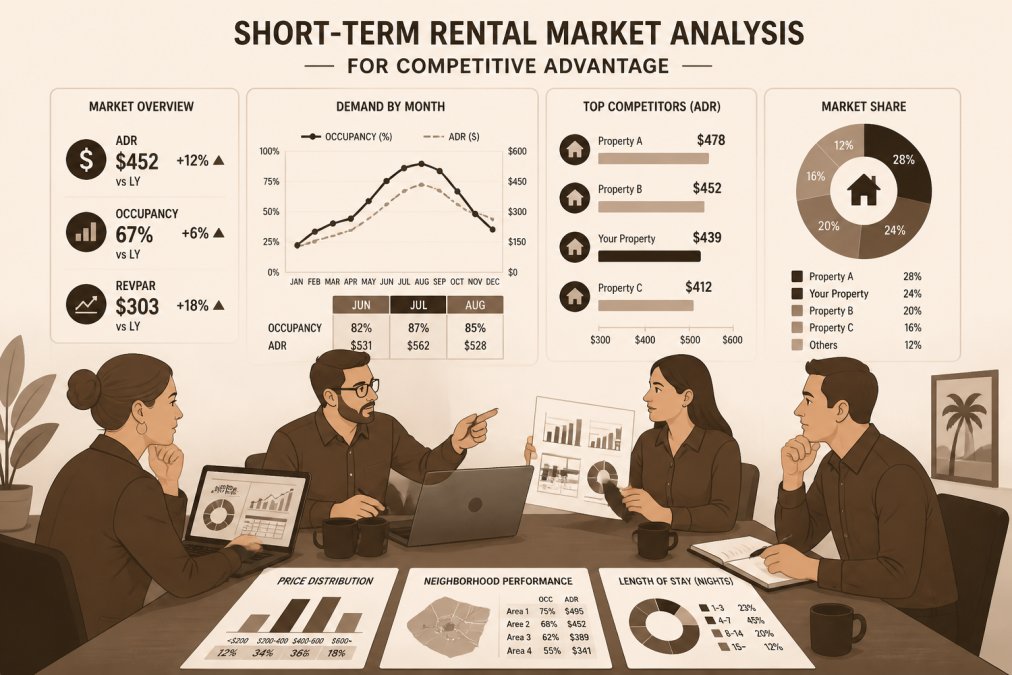
Short-Term Rental Market Analysis for Competitive Advantage
Market analysis answers a critical question: "Where does my property stand relative to the competitive set, and what pricing and positioning changes will improve my position?"
Benchmarking Your Property Against Local Competitors
Benchmarking is the process of identifying comparable properties and measuring your performance against theirs. A true comparable property has similar size, amenities, location proximity, and guest experience level.
Identify 8-12 comparable properties in your market. Track their:
- Nightly rates (base rates and seasonal adjustments)
- Occupancy rates (if visible through booking data)
- Guest reviews and ratings
- Amenities and property condition
- Listing visibility and search ranking
This reveals your competitive position. If comparable properties average $180/night and yours is $140, you're either underpriced or your property is perceived as lower quality. If your reviews average 4.6 stars while competitors average 4.8, you have a service or condition issue to address.
Market intelligence also reveals gaps. If no properties in your market offer a specific amenity (home gym, private pool, chef's kitchen), adding it can justify premium pricing. If every property offers the same basic amenities, you're competing on price and reviews alone, a difficult position.
The data often reveals that owners in the same market have wildly different pricing strategies. Some charge $100/night with 90% occupancy; others charge $200/night with 60% occupancy. Both can be profitable, but the economics are entirely different. Your benchmarking analysis should clarify which positioning makes sense for your property.
Data Integration and Automated Workflows
Collecting data is one thing; acting on it is another. Data integration means connecting your various information sources, booking platforms, review sites, financial records, operational logs, into a unified system where you can see the complete picture.
Many property owners use disconnected tools: Airbnb for bookings, Vrbo for another channel, spreadsheets for expenses, email for guest communication. This fragmentation makes it nearly impossible to spot trends or optimize operations. You're managing by scattered data points instead of a coherent system.
Automated workflows ensure that insights translate into action. When occupancy drops below target, automated alerts notify you to adjust pricing. When a guest leaves a negative review mentioning cleanliness, automated tasks create a maintenance ticket. When booking velocity slows, automated emails encourage direct bookings by offering incentives.
The practical benefit is that you're not manually checking metrics daily or manually triggering responses. The system flags exceptions and executes predetermined actions. This is especially critical for remote owners who can't physically manage properties daily.
Data Privacy, Security, and Small-Scale Implementation
Data collection raises legitimate privacy concerns. Guest information, names, contact details, payment data, booking history, must be protected. In Costa Rica, data protection is governed by regulations that require proper handling of personal information.
For small-scale operators managing one or two properties, privacy compliance doesn't require extensive infrastructure. It requires clear policies: how long you retain guest data, who has access, how data is encrypted, and what happens if there's a breach. Document these practices and communicate them to guests.
Security is equally important. Use password protection, two-factor authentication, and reputable platforms for storing financial and guest data. Avoid storing sensitive information in unencrypted spreadsheets or email. The cost of a data breach, both reputationally and legally, far exceeds the investment in basic security.
Small-scale implementation means starting with the metrics that matter most. You don't need enterprise-level analytics software. A spreadsheet tracking occupancy, ADR, RevPAR, and review scores is sufficient to identify trends and make informed decisions. As your portfolio grows, you can invest in more sophisticated tools.
Building Your Data-Driven Vacation Rental Strategy
A data-driven strategy starts with clarity on your financial goal. Are you optimizing for maximum revenue, stable occupancy, or a balance of both? Your goal shapes which metrics you prioritize and how you respond to data.
Next, establish a measurement baseline. What are your current occupancy rate, ADR, RevPAR, and review rating? These become your reference point for evaluating improvements. Without a baseline, you can't assess whether changes are working.
Then implement the feedback loop: collect data → analyze trends → test adjustments → measure results → repeat. This cycle should run monthly at minimum. If you adjust pricing in January, measure the impact by March. If you improve a property amenity, track whether reviews improve and occupancy increases.
The most successful property owners we work with at Marquis Stays Property Management treat their properties as data-informed businesses, not passive investments. They know their numbers. They understand their competitive position. They adjust strategy based on evidence, not guesswork. This approach consistently produces higher revenue, more stable occupancy, and better guest satisfaction than properties managed reactively.
The data is available to every owner. What separates high performers from average ones is the discipline to collect it, the willingness to act on it, and the patience to measure results over time. That's not complex. It's just methodical.
Building a data-driven vacation rental strategy requires more than knowing which metrics to track, it requires a partner who understands both the data and the operational execution. Marquis Stays Property Management combines comprehensive revenue optimization with full-service management, handling everything from dynamic pricing and market analysis to guest communication, housekeeping, and maintenance. Our data-driven approach has helped remote owners in Tamarindo, La Fortuna, Potrero, and Guanacaste increase direct booking revenue and maintain consistent occupancy. List My Property with Marquis Stays and let our team transform your property's performance through data-informed decisions and operational excellence.
Frequently Asked Questions
What is the difference between data-driven vacation rental management and traditional management?
Data-driven management uses real-time metrics like occupancy rates, average daily rate, and RevPAR to make pricing and operational decisions, rather than relying on intuition or static strategies. Traditional management often uses fixed pricing and generic marketing. Data-driven approaches adjust pricing based on market demand, seasonality, and competitor benchmarking, typically resulting in higher revenue per available room and better guest satisfaction through predictive analytics and targeted outreach.
How can vacation rental key performance indicators improve my property's profitability?
KPIs like booking velocity, lead time, and conversion rates reveal exactly which marketing channels work, when guests book, and what pricing maximizes revenue without reducing occupancy. By tracking guest sentiment and repeat booking rates, you identify what keeps guests returning. Monitoring customer acquisition cost against lifetime value helps you invest in the right channels. These metrics eliminate guesswork and direct your effort toward what actually drives profit rather than vanity metrics.
What should I do if my data shows conflicting signals, high occupancy but low revenue per room?
This typically means your average daily rate is too low relative to demand. Use market intelligence and competitor benchmarking to identify what similar properties charge during the same season. Adjust your pricing upward incrementally while monitoring booking velocity; if bookings drop, you've found your ceiling. You may also have high seasonal variation, analyze data by season and region separately. Sometimes the data reveals you're attracting budget guests when your property's amenities and location warrant premium positioning.
How does short-term rental market analysis help me price my property competitively?
Market analysis identifies what comparable properties in your region charge, their occupancy rates, and seasonal demand patterns. This benchmarking data shows you where your pricing sits relative to competitors and whether you're undervalued or overpriced. Combining market intelligence with your own booking velocity and guest demographics reveals the optimal price point for each season. Properties in high-demand areas like Tamarindo or Potrero can command premium rates; understanding local market trends ensures you capture that value without pricing yourself out of the market.
This article was written using GrandRanker